GIS大屏中如何将中国地图绘制为Albers投影?
小编最近又接到一个GIS大屏类的需求,老大让我调研下目前市面上主要的风格(还调研个毛啊,80%领导蓝)。这不是巧了么,小编在之前的文章《BigDataView-100多套GIS大屏源码公开下载!》正好介绍过相关的大屏作品集,再加上之前群里大家分享的各类示例,总算交了差。
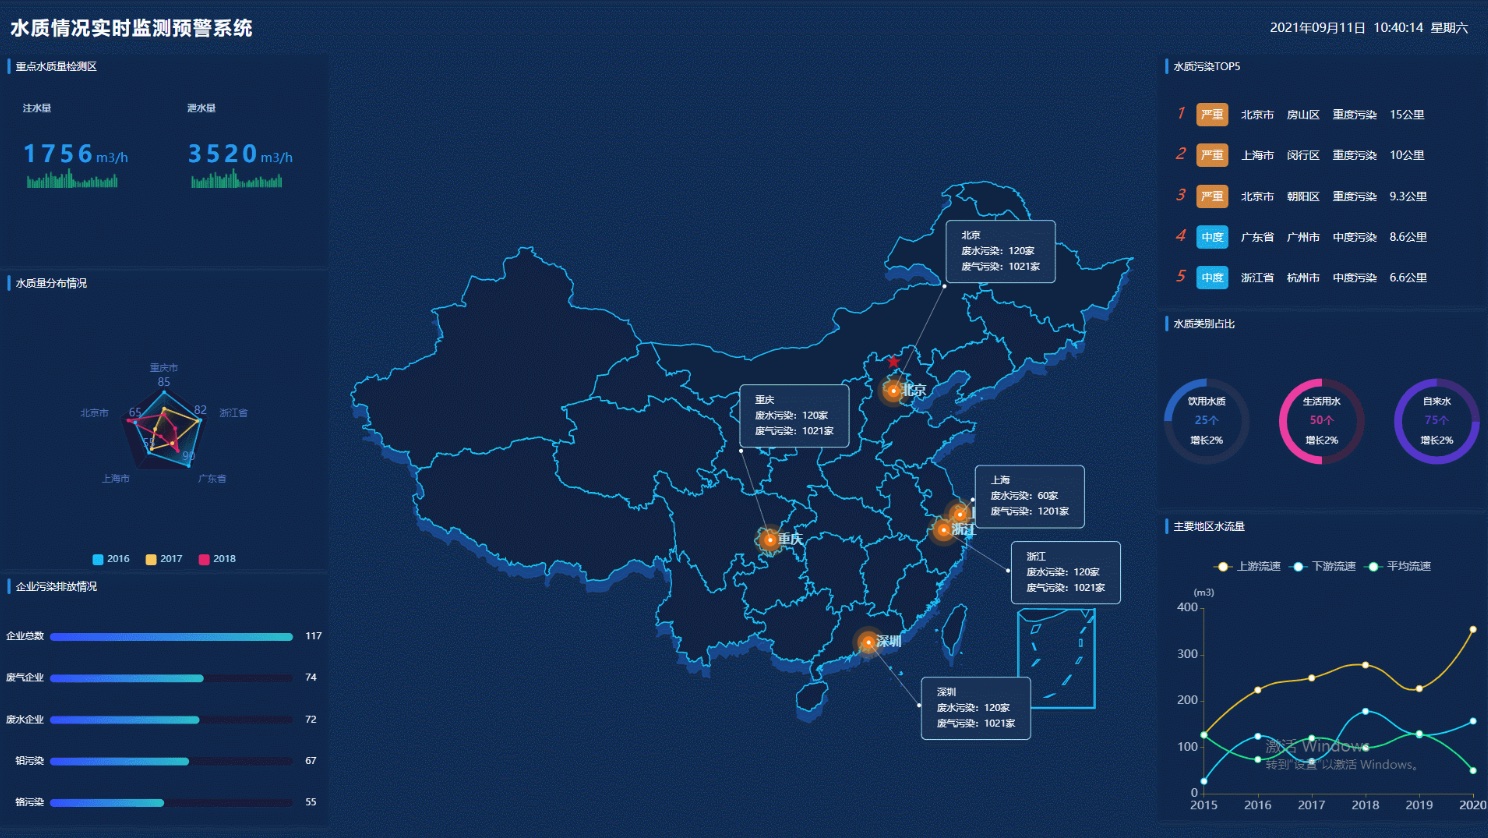
不过调研的过程中小编发现了一个有趣的现象,很多大屏使用的地图还是EPSG:3857,导致绘制的中国地图是“低着头”的,于是小编就以 OpenLayers 和 Leaflet 为例,结合着各种AI,写两个 Demo 来实现 Albers 投影在Web中渲染。

OpenLayers实现
要实现这个自定义投影的Web地图绘制,OpenLayers 是小编第一推荐的,它原生支持投影转换,并且功能非常全面。
先引入依赖库
 <link rel="stylesheet" href="https://cdn.jsdelivr.net/npm/ol/ol.css">
  <!-- OpenLayers -->
  <script src="https://cdn.jsdelivr.net/npm/ol/dist/ol.js"></script>
  <!-- Proj4 -->
  <script src="https://cdn.jsdelivr.net/npm/proj4@2.8.0/dist/proj4.js"></script>
  <script type="module" src="https://cdn.jsdelivr.net/npm/ol/proj/proj4.js"></script>
这里要注意的是 proj4 的引用要加一个 type="module" 属性,否则浏览器会报错。
核心JS代码如下:
  // 注册自定义 Albers 投影
  proj4.defs("EPSG:100001",
    "+proj=aea +lat_1=25 +lat_2=47 +lat_0=30 +lon_0=105 +x_0=0 +y_0=0 +datum=WGS84 +units=m +no_defs"
  );
  ol.proj.proj4.register(proj4);

  const albersProjection = ol.proj.get("EPSG:100001");

  // 给投影加一个范围,方便 OL 定位
  albersProjection.setExtent([-3000000, -2000000, 3000000, 3000000]);

  // 创建一个矩形 Polygon(经纬度下的中国范围),再投影到 Albers
  const feature = new ol.Feature({
    geometry: ol.geom.Polygon.fromExtent([73, 18, 135, 53]) // roughly China bbox in EPSG:4326
  });
  feature.getGeometry().transform("EPSG:4326", "EPSG:100001");

  const vectorLayer = new ol.layer.Vector({
    source: new ol.source.Vector({
      url: "province.geojson", // 你的GeoJSON路径
      format: new ol.format.GeoJSON({
        dataProjection: "EPSG:4326",       // 源数据是WGS84
        featureProjection: "EPSG:100001"   // 转换到自定义投影
      })
    }),
    style: new ol.style.Style({
      stroke: new ol.style.Stroke({ color: "red", width: 2 }),
      fill: new ol.style.Fill({ color: "rgba(255,0,0,0.1)" })
    })
  });

  const map = new ol.Map({
    target: "map",
    layers: [vectorLayer],
    view: new ol.View({
      projection: albersProjection,
      center: ol.proj.fromLonLat([105, 35], albersProjection),
      zoom: 3
    })
  });
运行效果如下图:

当然也可以配合之前文章《colormap-WebGIS分级设色开源工具包》中的工具来实现分层设色。

Leaflet实现
Leaflet中实现方法也类似,需要借助Proj4Leaflet这个三方库模块来实现,简易代码如下:
先引入依赖资源:
<link rel="stylesheet" href="https://unpkg.com/leaflet/dist/leaflet.css" />
  <script src="https://unpkg.com/leaflet/dist/leaflet.js"></script>

  <!-- Proj4 & Proj4Leaflet -->
  <script src="https://cdnjs.cloudflare.com/ajax/libs/proj4js/2.8.0/proj4.js"></script>
  <script src="https://cdnjs.cloudflare.com/ajax/libs/proj4leaflet/1.0.2/proj4leaflet.js"></script>
再手动设置坐标系,然后创建地图:
// 定义 Albers 投影 (proj4 格式)
  var albersProj4 = "+proj=aea +lat_1=25 +lat_2=47 +lat_0=30 +lon_0=105 +x_0=0 +y_0=0 +datum=WGS84 +units=m +no_defs";

  // 创建自定义 CRS
  var customCRS = new L.Proj.CRS("EPSG:100001", albersProj4, {
    // 手动设置范围 (这里随便给一个足够大的范围)
    bounds: L.bounds([-4000000, -2000000], [4000000, 4000000]),
    resolutions: [
      8192, 4096, 2048, 1024, 512, 256, 128, 64, 32, 16, 8, 4, 2, 1
    ]
  });

  // 创建地图
  var map = L.map("map", {
    crs: customCRS,
    center: [35, 105],  // 中国大致中心 (会被投影转换)
    zoom: 2
  });

  // 加载 GeoJSON (WGS84坐标)
  fetch("province.geojson")
    .then(response => response.json())
    .then(data => {
      var geojsonLayer = L.geoJson(data, {
        style: {
          color: "blue",
          weight: 1,
          fillColor: "rgba(0,0,255,0.1)",
          fillOpacity: 0.5
        }
      }).addTo(map);

      map.fitBounds(geojsonLayer.getBounds());
    });
效果如图:

GeoJSON数据
本文测试使用的数据来自《「GIS数据」2024国家标准矢量地图(精确到县)审图号:GS(2024) 0650 》,有需要的可以自行下载。
还没有完成的工作
虽然我们通过前端地图框架的能力将GeoJSON数据进行了自定义投影的渲染,但底图数据仍然没有进行投影处理,所以本文展示的效果图中都没有包含底图。如果你的需求中还需要加载底图进行匹配,可以考虑启动一个 WMS/WMTS 服务把 底图 重投影成 Albers(比如自己搭建 GeoServer)。
所有源代码
本文测试使用的源码托管在github上,有需要的可以参考:
https://github.com/sailor103/WebForAlbers
相关阅读
声明
1.本文所分享的所有需要用户下载使用的内容(包括但不限于软件、数据、图片)来自于网络或者麻辣GIS粉丝自行分享,版权归该下载资源的合法拥有者所有,如有侵权请第一时间联系本站删除。
2.下载内容仅限个人学习使用,请切勿用作商用等其他用途,否则后果自负。


