「GIS教程」使用Vue和Leaflet实现地图聚合功能
发布时间: 2023-07-24
所属分类: Leaflet学习笔记
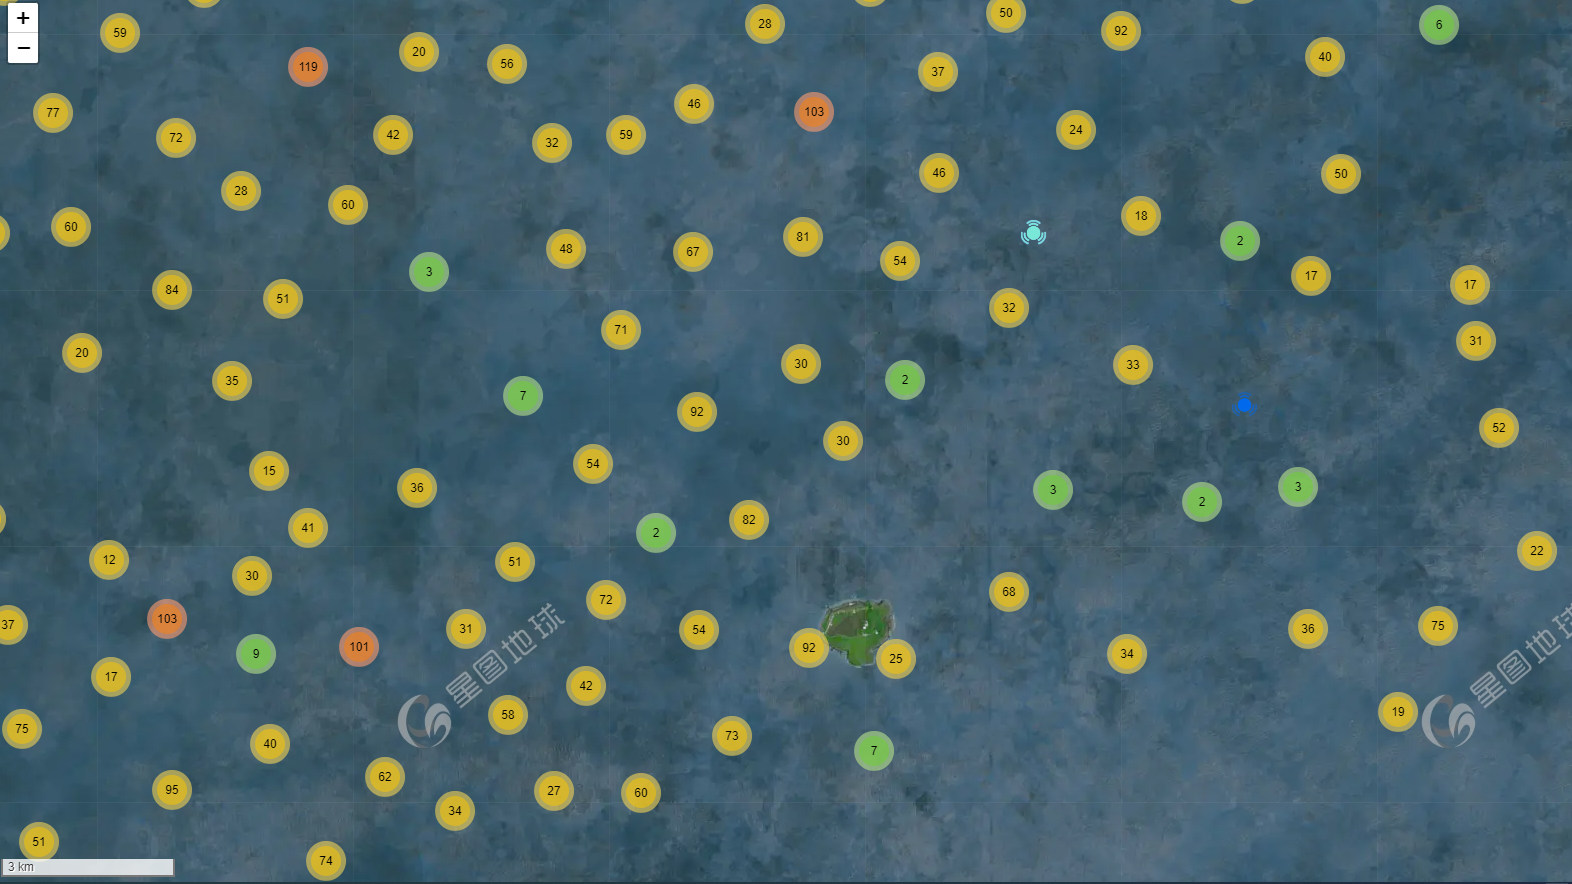
本文介绍了Web端使用Leaflet开发库进行地图聚合查询的一种方法 (底图来源:中科星图),结合Leaflet.markercluster插件能够快速的实现地图聚合查询功能,显示效果如下图所示。
开发环境
Vue开发库:3.2.37 & Leaflet开发库:1.9.3
Leaflet主要插件:Leaflet.markercluster
插件简介与安装
Leaflet.markercluster是为一个Leaflet提供漂亮的动画标记聚类功能的插件,优点是功能强大、简单易用,建议结合github文档仔细研究下,部分功能由于篇幅有限未列举;缺点是在大批量(10w+点数据)加载层级切换时,有明显的卡顿感。
# 插件安装
npm install leaflet.markercluster
# 插件安装(国内镜像,速度较快)
npm --registry https://registry.npm.taobao.org install leaflet.markercluster
# 引入地图聚合插件 Leaflet.markercluster
import "leaflet.markercluster/dist/MarkerCluster.css";
import "leaflet.markercluster/dist/MarkerCluster.Default.css";
import "leaflet.markercluster";
使用简介
// 创建新的聚合图层,向其添加标记,然后将其添加到地图中
const markerClusterLayer = L.markerClusterGroup({
    showCoverageOnHover: false, // 为true时,当鼠标悬停在点上时,它会显示它聚合的边界
    zoomToBoundsOnClick: true, //  为true时,当鼠标点击某个点时,会缩放到它的边界范围
    chunkedLoading: true,
    maxClusterRadius: 80, // 聚类从中心标记覆盖的最大半径(以像素为单位),默认值 80
}).addTo(map);
// 加载待聚合的geojson点数据
let geojson = pointData;
if (geojson) {
    let markerList = []; // 聚合标记点列表
    if (geojson.features.length > 0) {
        for (let i = 0; i < geojson.features.length; i++) {
            if (geojson.features[i].geometry) {
                // 属性
                const properties = geojson.features[i].properties;
                // 经纬度坐标
                const coordinate = geojson.features[i].geometry.coordinates;
                // 点状展示样式(无聚合状态)
                let img = dot3Url;
                const myIcon = L.icon({
                    iconUrl: img,
                    iconSize: [25, 25],
                });
                // 创建标记点
                const marker = L.marker(new L.LatLng(coordinate[1], coordinate[0]), {
                    properties: properties,
                    icon: myIcon,
                });
                markerList.push(marker);
            }
        }
    }
    // 添加聚合标记点列表
    markerClusterLayer.addLayers(markerList);
}
此外,L.markerClusterGroup还提供了几个别的属性:
| 属性 | 默认值 | 说明 | 备注 |
|---|---|---|---|
| showCoverageOnHover | true | 为true时,当鼠标悬停在聚合点上时,它会显示它聚合的边界 | |
| zoomToBoundsOnClick | true | 为true时,当鼠标点击某个聚合点时,会缩放到它的边界范围 | |
| spiderfyOnMaxZoom | true | 为true时,当你在最大缩放级别点击一个聚合点时,会将其蜘蛛化,以便你能看到其包含的所有标记 | |
| chunkedLoading | true | 为true时,将 addLayers 的处理流程拆分成小间隔时间去处理,这样页面不会看起来静止不动 | |
| removeOutsideVisibleBounds | true | 为true时,如果聚合点处于地图的显示区域外,则出于性能考虑将其从地图上移除 | |
| spiderLegPolylineOptions | {...} | 允许定义一个给蜘蛛脚一个多边形选项 PolylineOptions | 实测,无用 |
| maxClusterRadius | 80 | 聚合点从中心标记覆盖的最大半径(以像素为单位) |
详细源码(Vue3)
 为了防止资源恶意爬取导致被和谐,此处内容被作者隐藏。
验证码:
关注本站微信公众号,回复“资源下载”,获取验证码。
在微信里搜索“麻辣GIS”或微信扫描右侧二维码即可关注本站微信公众号。
<template>
  <div class="app-contain">
    <!-- leaflet 地图容器 -->
    <div id="myMap"></div>
  </div>
</template>

<script setup>
// 本地资源数据
import dot3Url from '/@/assets/images/dot3.png'
// 引入数据
import pointData from '/@/assets/mapData/heatData.json' // 地图聚合数据
// 引入样式
import { onMounted } from 'vue'
import L from 'leaflet';
import 'leaflet/dist/leaflet.css'
// 地图聚合 Leaflet.markercluster(聚合图层)
import "leaflet.markercluster/dist/MarkerCluster.css";
import "leaflet.markercluster/dist/MarkerCluster.Default.css";
import "leaflet.markercluster";
// 星图地球token
let geovisearthToken = 'YOURS_TOKEN'
let map = null;
const initMap = () => {
  const imagesLayer = L.tileLayer(`https://tiles1.geovisearth.com/base/v1/img/{z}/{x}/{y}?token=${geovisearthToken}`);
  const imagesLableLayer = L.tileLayer(`https://tiles1.geovisearth.com/base/v1/cia/{z}/{x}/{y}?token=${geovisearthToken}`);
  const layers = L.layerGroup([imagesLayer, imagesLableLayer])
  map = L.map('myMap', {  //需绑定地图容器div的id
    center: [25.67052, 121.99804], //初始地图中心
    zoom: 12, //初始缩放等级
    maxZoom: 20,
    minZoom: 2,
    zoomControl: true, //缩放组件
    attributionControl: false, //去掉右下角logol
    scrollWheelZoom: true, //默认开启鼠标滚轮缩放
    // 限制显示地理范围
    maxBounds: L.latLngBounds(L.latLng(-90, -180), L.latLng(90, 180)),
    layers: [layers] // 图层
  })
  // 添加比例尺要素显示
  L.control.scale({ maxWidth: 200, metric: true, imperial: false }).addTo(map)
  /** 地图聚合 */
  addMapFeature(pointData);
}

// 地图聚合
const addMapFeature = (pointData) => {
  // 创建新的聚合图层,向其添加标记,然后将其添加到地图中
  const projectPointLayer = L.markerClusterGroup({
    showCoverageOnHover: false, // 为true时,当鼠标悬停在聚合点上时,它会显示它聚合的边界
    zoomToBoundsOnClick: true, //  为true时,当鼠标点击某个聚合点时,会缩放到它的边界范围
    chunkedLoading: true,
    spiderfyOnMaxZoom: true,
    maxClusterRadius: 80, // 聚类从中心标记覆盖的最大半径(以像素为单位),默认值 80
    spiderLegPolylineOptions: { weight: 1, color: '#222', opacity: 0.5 },
  }).addTo(map);
  let geojson = pointData;
  if (geojson) {
    addProjectClusterLayers(geojson, projectPointLayer);
    projectPointLayer.on("click", function (e) {
      e.layer.unbindPopup(); // 用于解除地图图层(layer)与其关联的弹出窗口(popup)
      // 图层点击弹出窗口处理事件
      const elements = getProjectPopupContent(e.layer.options.properties); // 返回内容
      e.layer.bindPopup(elements).openPopup(e.latlng); // 弹窗
    });
  }
};

/*
 * 点单击内容函数
 */
const getProjectPopupContent = (item) => {
  // 内容及单击事件
  const elements = `<div>${toPopupItemStr("经度", item.lon)} ${toPopupItemStr("纬度", item.lat)} ${toPopupItemStr("阈值", item.valve)}</div>`;
  return elements;
};
const toPopupItemStr = (name, value) => {
  return value ? `<b>${name}:</b>${value}<br>` : "";
};

/*
 * 加载聚合图层
 */
const addProjectClusterLayers = async (geojson, clusterlayer) => {
  let markerList = []; // 聚合标记点列表
  if (geojson.features.length > 0) {
    for (let i = 0; i < geojson.features.length; i++) {
      if (geojson.features[i].geometry) {
        const properties = geojson.features[i].properties;
        const coordinate = geojson.features[i].geometry.coordinates;
        /*  点状展示样式(无聚合状态) */
        let img = dot3Url;
        const myIcon = L.icon({
          iconUrl: img,
          iconSize: [25, 25],
        });
        const marker = L.marker(new L.LatLng(coordinate[1], coordinate[0]), {
          properties: properties,
          icon: myIcon,
        });
        markerList.push(marker);
      }
    }

  }
  clusterlayer.addLayers(markerList);
};

onMounted(() => {
  initMap()
})
</script>

<style scoped>
#myMap {
  width: 92vw;
  height: 92vh;
}
</style>
所有Leaflet笔记
所有Leaflet学习笔记笔记 ---> Leaflet学习笔记
相关阅读


声明
1.本文所分享的所有需要用户下载使用的内容(包括但不限于软件、数据、图片)来自于网络或者麻辣GIS粉丝自行分享,版权归该下载资源的合法拥有者所有,如有侵权请第一时间联系本站删除。
2.下载内容仅限个人学习使用,请切勿用作商用等其他用途,否则后果自负。
手机阅读
公众号关注
知识星球
手机阅读

最新GIS干货

私享圈子


